Roger Sylvester-Bradley
Farm nutrient knowledge has a new value
Farm nutrition decisions – how good are they? High fertiliser and grain prices mean nutrient errors now have high costs. So how can they be avoided?
I have been a crop scientist for 50 years, 43 of them in ADAS, working with soil & crop scientists striving to improve crop nutrition. The first thing I did on joining ADAS in 1979 was to assess how helpful our fertiliser recommendations were. We saw that nitrogen (N) rates needed to increase because yields were still going up, but also, I saw they were often wrong, and it wasn’t clear why.
Now, after decades of research, have fertiliser recommendations and farm decisions improved? And could they improve more? The answer is that, until recently, we didn’t know! Puzzlingly, no-one has thought it was worth monitoring final crop nutrient status! Yes, we have been measuring soil nutrients for decades, but this doesn’t tell us if our crops were happy! The only way to know whether a crop was nutritionally satisfied throughout its life is to ask it! … by analysing it, when its life is over, i.e. at harvest.
Now we have realised that grain analysis is nutritionally meaningful, we know how good (or bad) we are at providing crops with the correct amount of nutrients! We have been analysing hundreds of crops at harvest for six years now, studying international research into critical grain levels, and getting ever better at interpreting them, not just in cereals but also in oilseeds and pulses.
Our conclusion is that UK crops are still seldom happy with their nutrition. Over 80% have had too little of at least one nutrient – or some have had too much, in the case of N – and over 50% have had too little of more than one nutrient. This doesn’t just concern crop happiness – it affects farm profits in a big way.
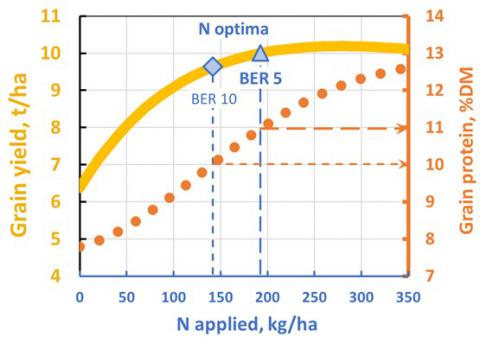
In cereals, the best estimate of grain N with optimal nutrition comes from protein levels in AHDB Recommended Lists (RL); protein deviations from this of 1% relate to an error in total N applied of 50 kg/ha (Figure 1), and deviations of 2% or more cost ~£100/ha or more at 2021 prices.
A significant amount of farm data is now showing protein deviations to be very variable, with under-supply more common than over-supply! Only ~50% of fields had protein levels within 1% of their RL target level in recent years, while 20% of fields were outside 2% of their RL target; 12% of fields had an apparent N shortfall of more than 100 kg/ha whilst 8% appeared to have exceeded their optimal N supply by more than 100 kg/ha. Overall, this suggests that imprecise N management cost the average farm £63/ha in lost profit in 2021. The much higher prices in 2022 mean not only that N optima will be less (by ~50 kg/ha) but that costs of N imprecision will be doubled at least! So, lessons learned from benchmarking grain N (or protein) levels have just doubled in value.
Additionally, when we look at grain P & K, potential savings in fertiliser costs from farms using grain analysis to estimate phosphate and potash offtakes instead of ‘book’ values have now tripled (to £300 per average field) and are much more variable than they were last year.
Analysis of all grain nutrients also enables farms to begin understanding their minor- (Mg, S & Ca) & micro-nutrient (Fe, Mn, Zn, Cu, B & Mo) issues. Most farms see some deficiencies, and it is striking how analysis of six or more fields per farm shows these deficiencies to differ across whole farms.
Overall, we estimate that, with current high prices, grain analysis with benchmarking would identify nutritional errors costing around £33K in lost profit on an ‘average farm’ (with 20 fields of 10 ha growing grain crops) and would cost only £900. This is the value and cost of ‘learning by sharing’ grain nutrient data. Surely crop nutrient post-mortems have become a ‘no-brainer’, and all farms should now do them routinely?
Further reading – see our AHDB-funded reports on how high prices affect optimum N applications, and see our YEN Crop Nutrition Review for 2021 here
| ACTION - Measure and record grain yields year by year, and field by field. - Measure, record and compare (benchmark) grain nutrients year by year, and field by field – by registering ASAP to join YEN Nutrition here. - Measure and record soil organic matter, pH & nutrients (P, K & Mg, and maybe mineral N, Cu, Zn & B) every few years, and field by field. - Calculate uptakes and offtakes of each nutrient on each field each year, and compare. - Try to match each nutrient application on each field to the shortfall between normal demand (uptake) and estimated supply, allowing for inefficiencies of the product. - Form an understanding of your main nutritional issues, so that you can focus on planning solutions for your problematic fields and nutrients. |